Desktop Application
[Highlight Project]
1. Introduction
1-1. Overview
The system implements core graph algorithms such as calculating shortest path, computing all equivalent shortest paths and node centrality (closeness and betweenness) in C++, and complements them with an interactive graph visualization interface built using D3.js and served through a local Python web server. It processes multiple types of real-world graph data, offering both computational analysis and visual insight into complex network structures.
It was the final individual assignment project (个人大作业) assigned in "Data Structure and Algorithm (数据结构与算法)" class in grade 2 (1st Semester).
1-2. Development Environment
- Operating System: Windows 7 (64-bit)
- IDE: Visual Studio 2013 (for C++ algorithm development)
Programming Languages:
- C++ - Graph algorithm implementation
- JavaScript - Frontend visualization
- Python 3.5.3 - Local web server
- Python Tooling: PyInstaller 3.2.1 (for building executable server)
- Hardware: 8 GB RAM
1-3. Input Data & Structure
The program works with three datasets: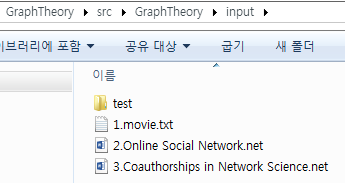
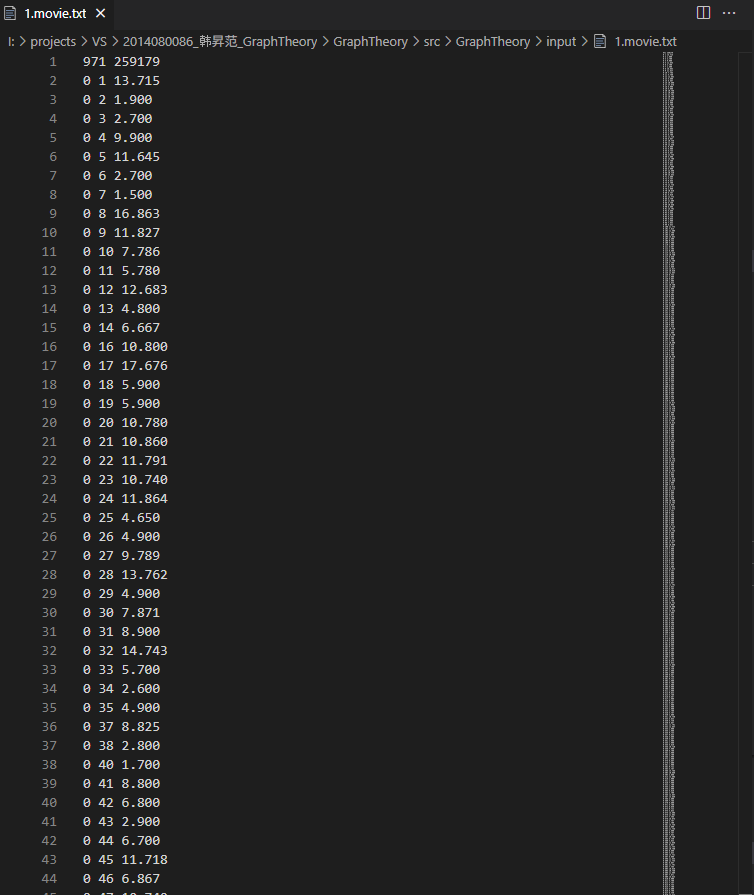
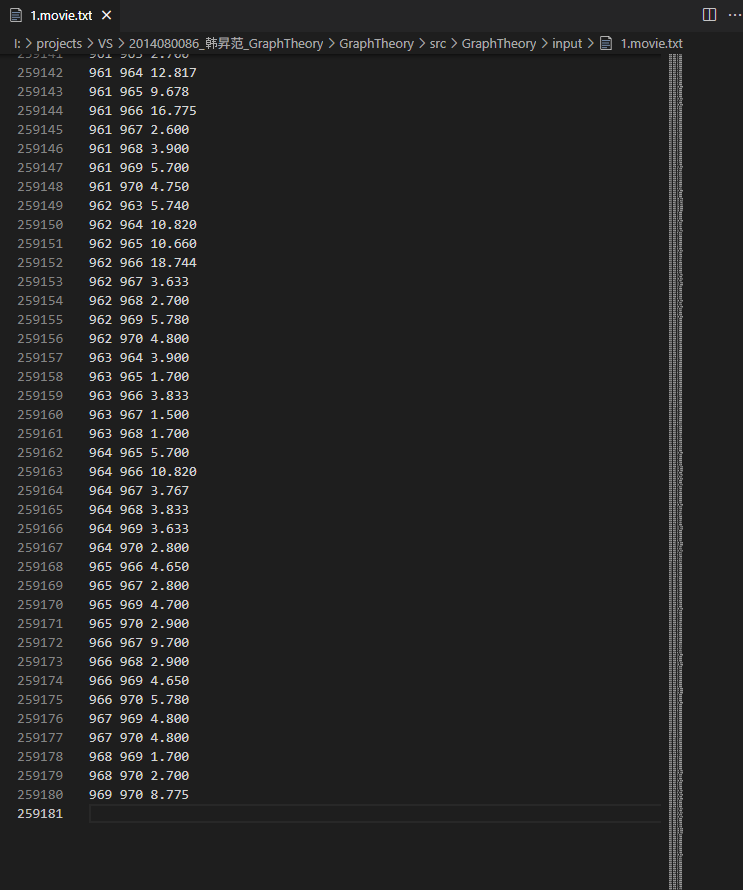
- "1.movie.txt"
- Vertices (Nodes): 971
- Edges: 259,179
- Each line describes one edge in the format:
<nodeA> <nodeB> <weight> - Undirected: Since edges like 0 1 and 1 0 are not duplicated, we assume this graph is undirected and each connection is mutual.
- Dense: With 971 nodes and 259,179 edges, this is a very dense graph. The maximum number of undirected edges in a graph with 971 nodes is: (971*(971 - 1))/2 = 471,835 So the graph is over 50% connected.
- Weighted: All edges have associated floating-point weights.
- This graph is a weighted undirected graph, represented in a simplified edge list format (commonly used for graph computation and analysis tasks).
- Images of Content:
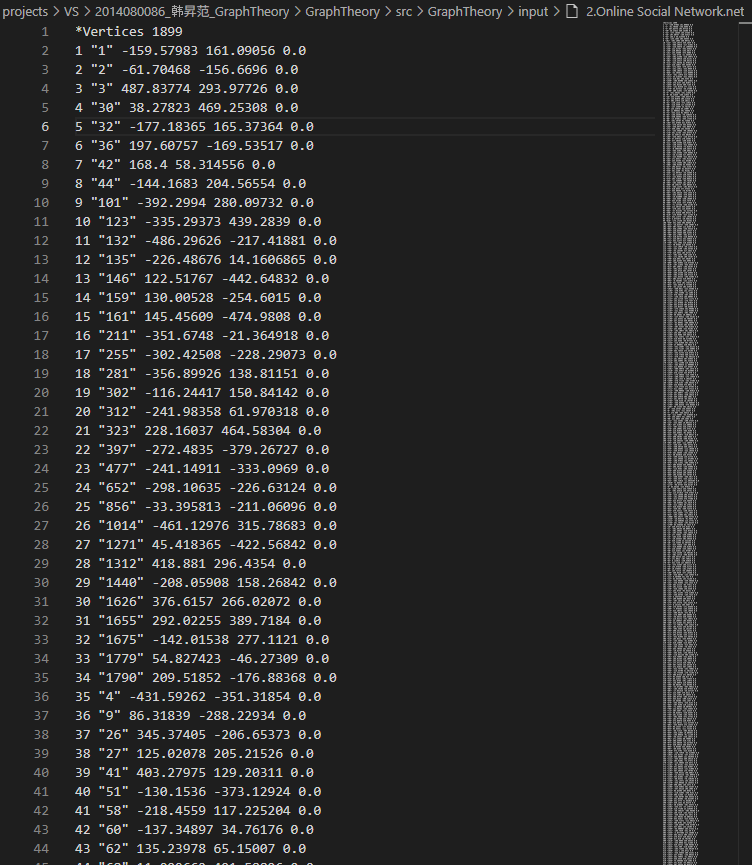
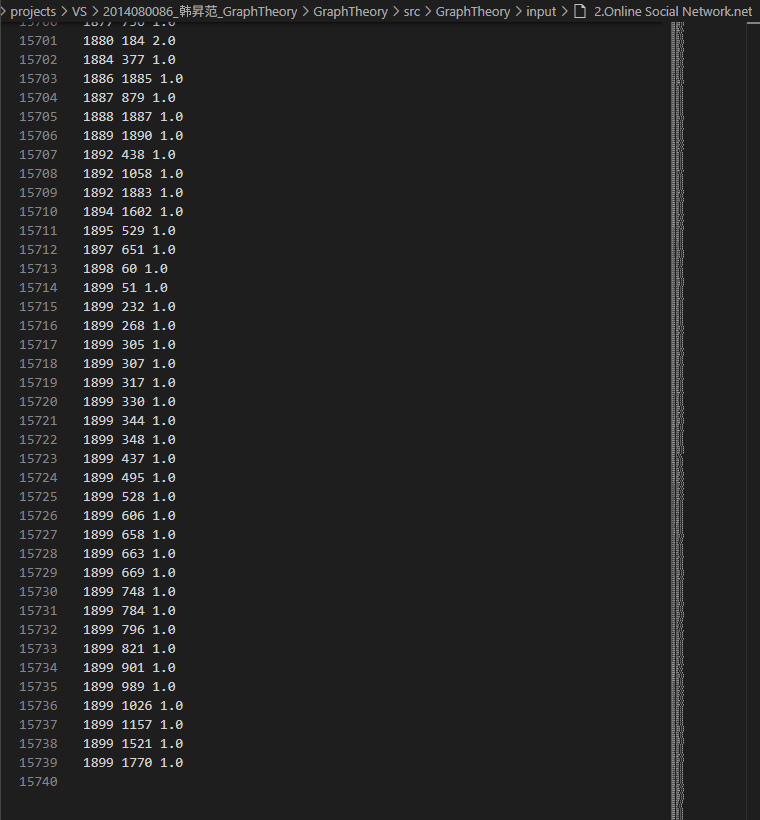
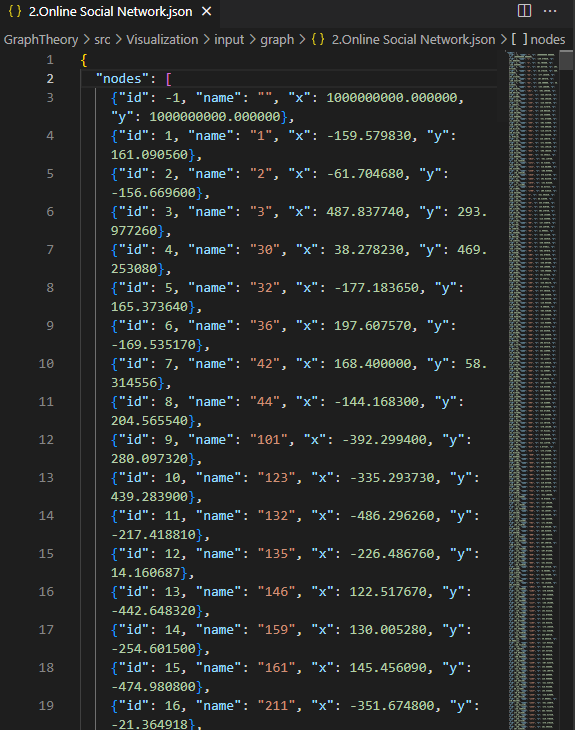
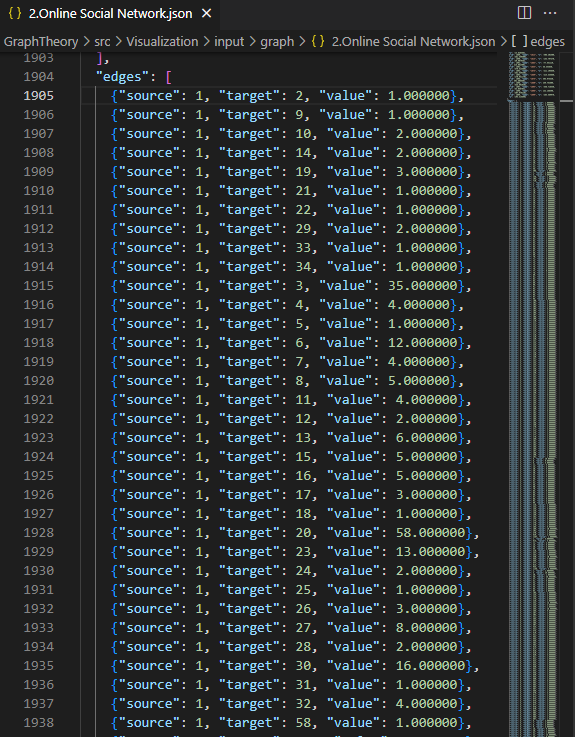
- "2.Online Social Network.net"
- Vertices (Nodes): 1,899
- Format: Pajek .net format
Node ID (1-based) Label (e.g., "1", "2") X and Y coordinates for graph layout Z coordinate (usually unused) - Images of Content:
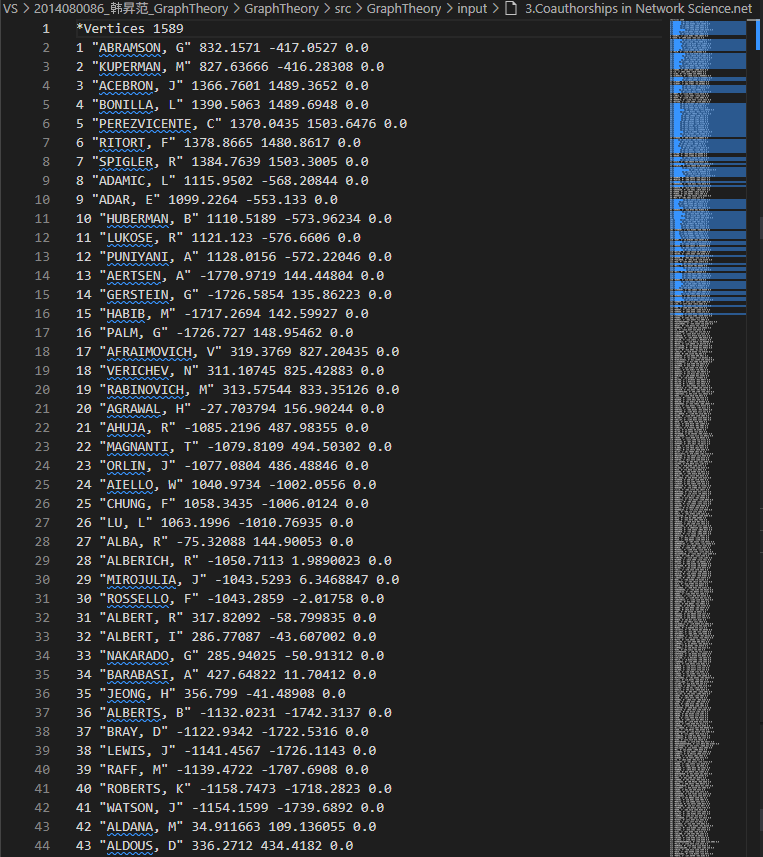
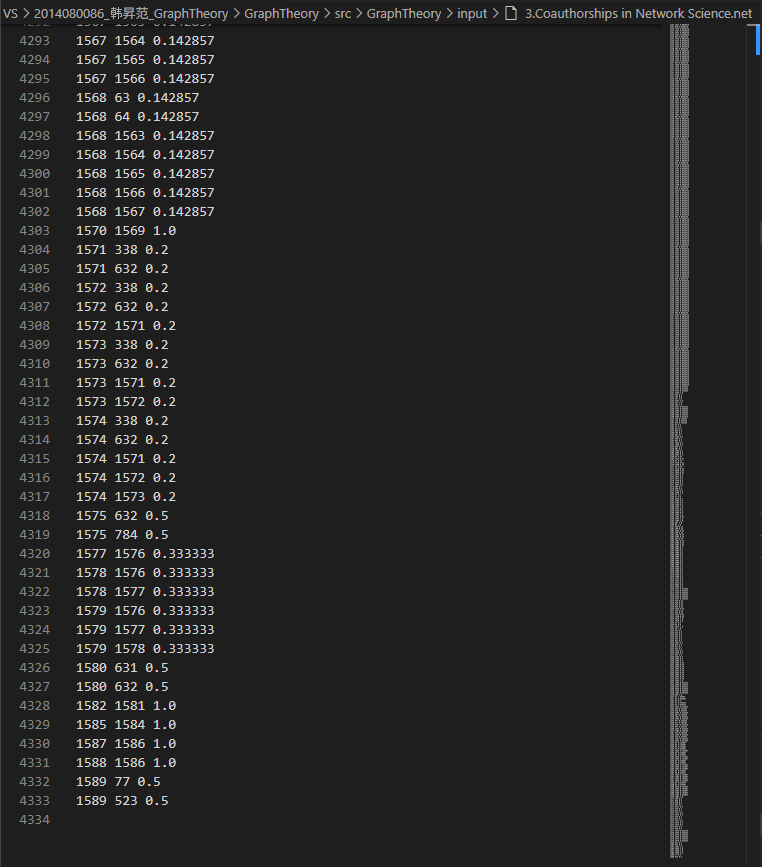
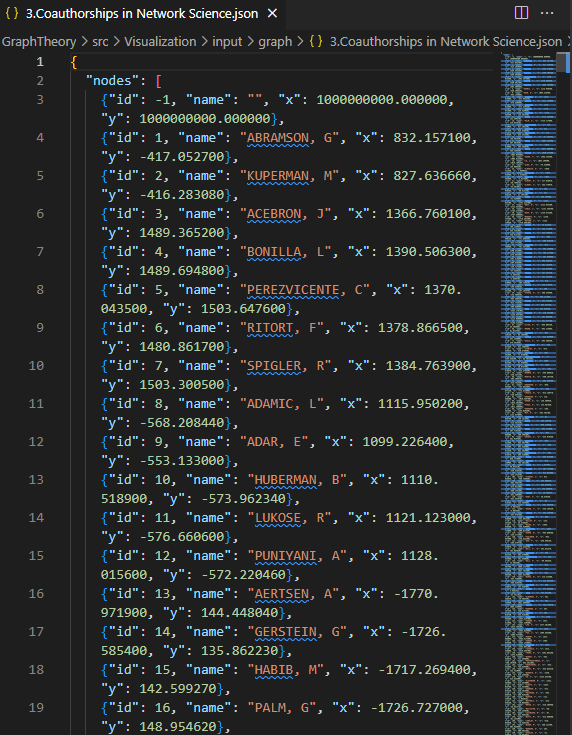
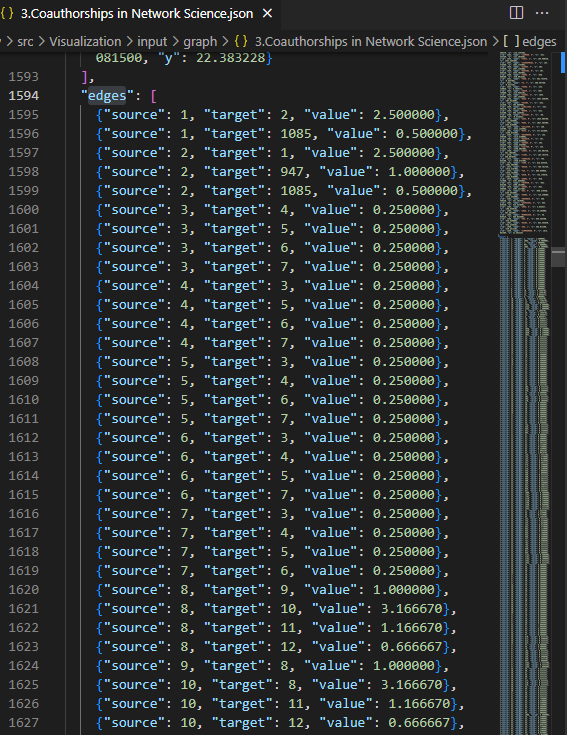
- "3.Coauthorships in Network Science.net"
- Number of Nodes (Vertices): 1,589
- Format: Pajek .net format
Node ID (1-based) Author Name as label (e.g., "ABRAMSON, G") X and Y coordinates for graph layout Z coordinate (usually unused) - Images of Content:
1-4. Program Requirements Analysis
- 1. Calculate Shortest Path
- Core Algorithm: Dijkstra Algorithm
- 2. Calculate Centrality (Closeness Centrality, Betweenness Centrality)
- (1) Core Algorithm: Dijkstra Algorithm
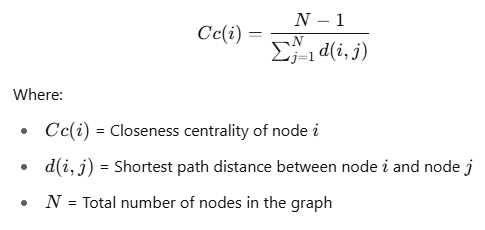
- (2) Closeness Centrality Calculation:
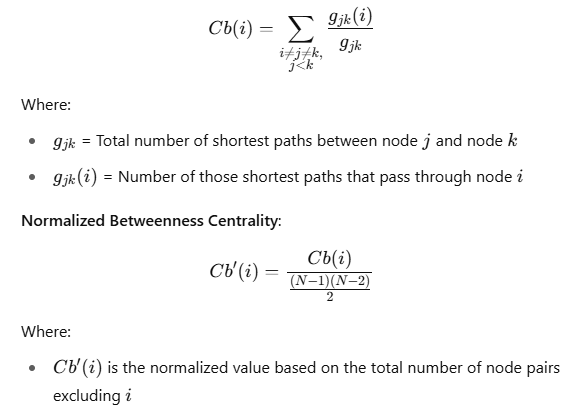
- (3) Betweenness Centrality Calculation:
1-5. Features & Implementation
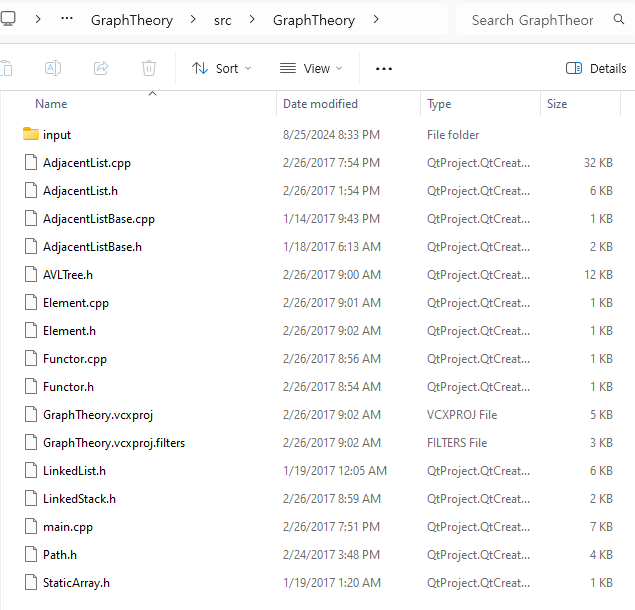
- Data Structures:
- Adjacent List
- AVL Tree
- Linked List
- Linked Stack
- Shortest Path Computation
- Algorithm: Dijkstra's algorithm
- Capabilities:
- Calculate the shortest path between two given nodes
- Compute all equivalent shortest paths between two nodes
- Node Centrality Analysis
- Algorithm Base: Dijkstra's algorithm
- Measures how often a node lies on shortest paths between other nodes.
- Computed using the frequency of node appearances in shortest paths
- All centrality results are written to file, including identifiers, scores, and placeholder entries (id = -1) for missing nodes.
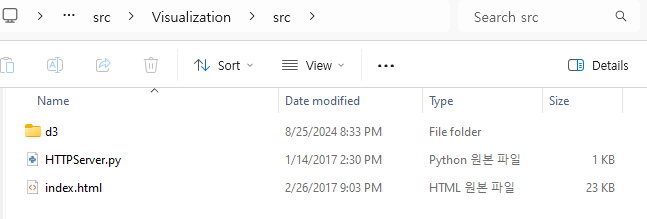
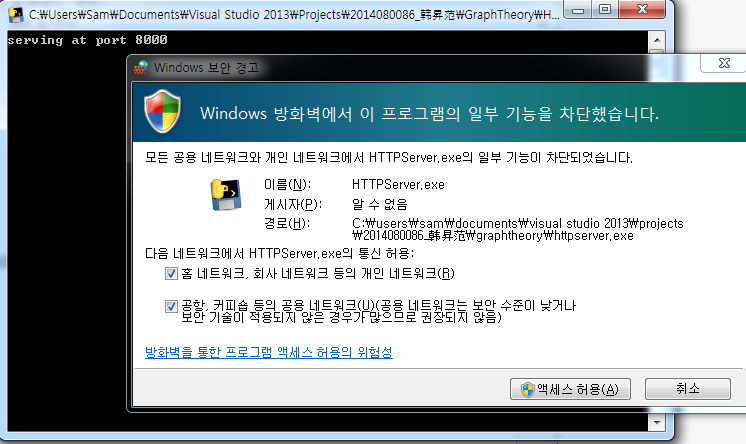
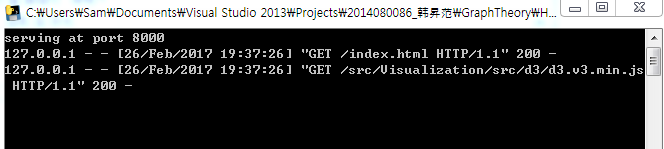
- Integrated Python and JS technologies for visualization
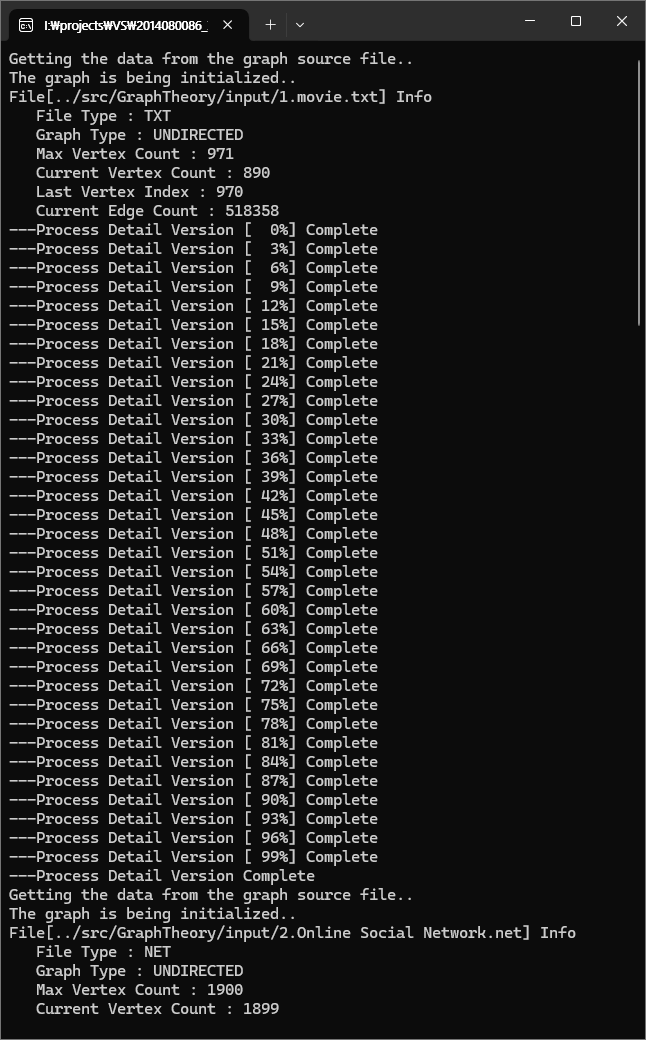
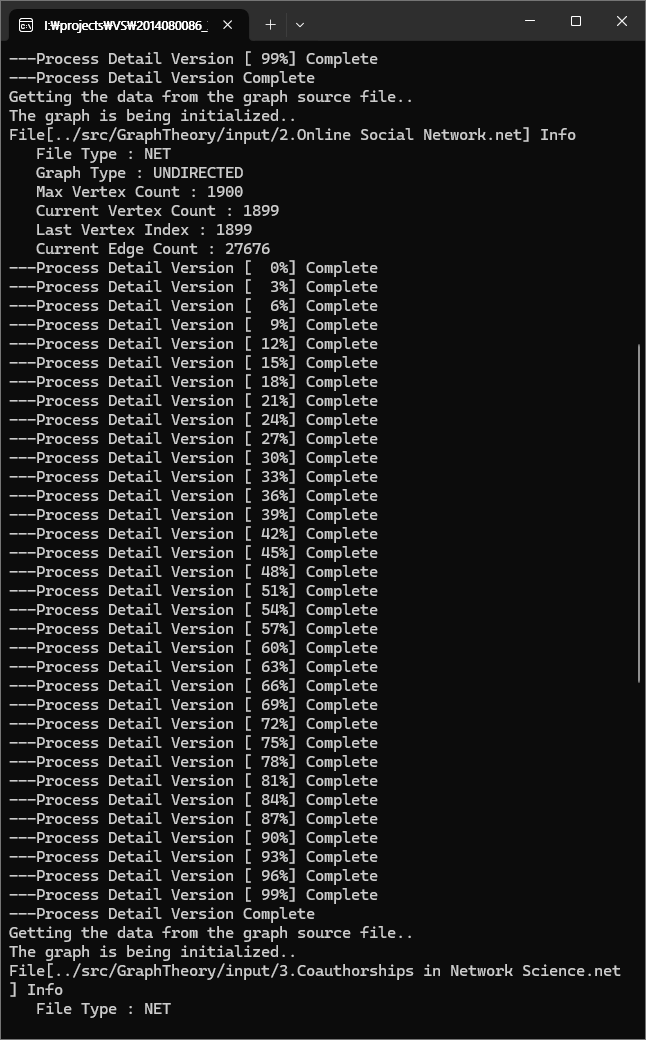
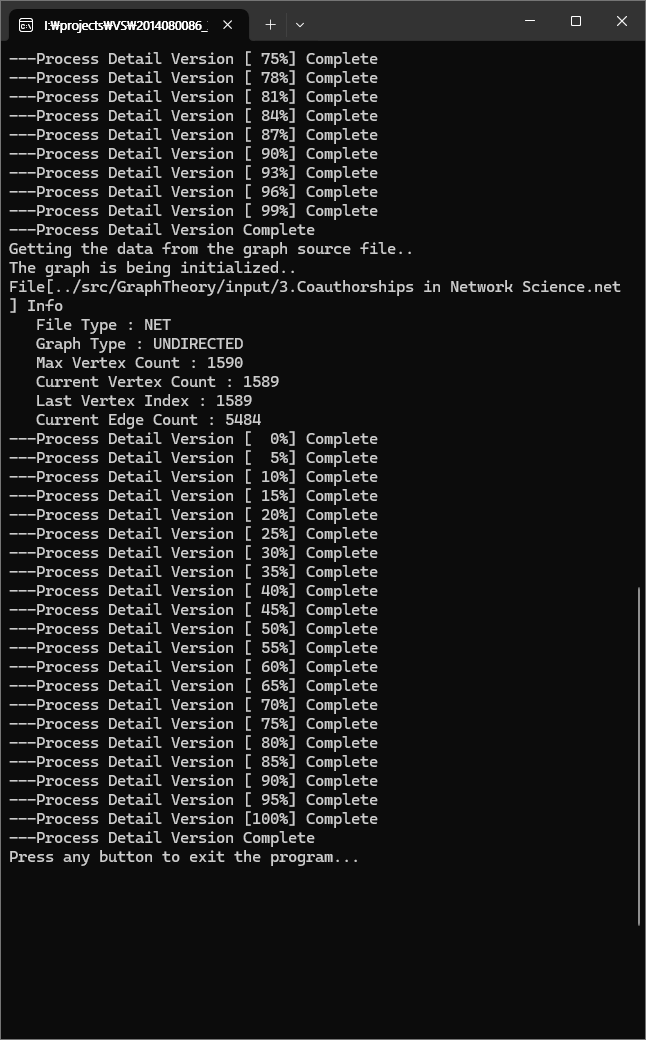
1-6. Program Output
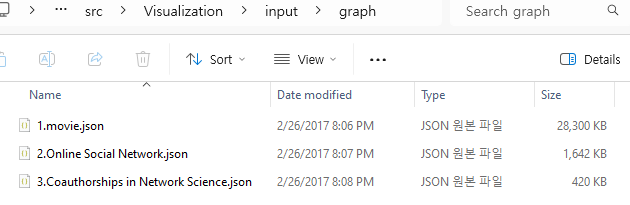
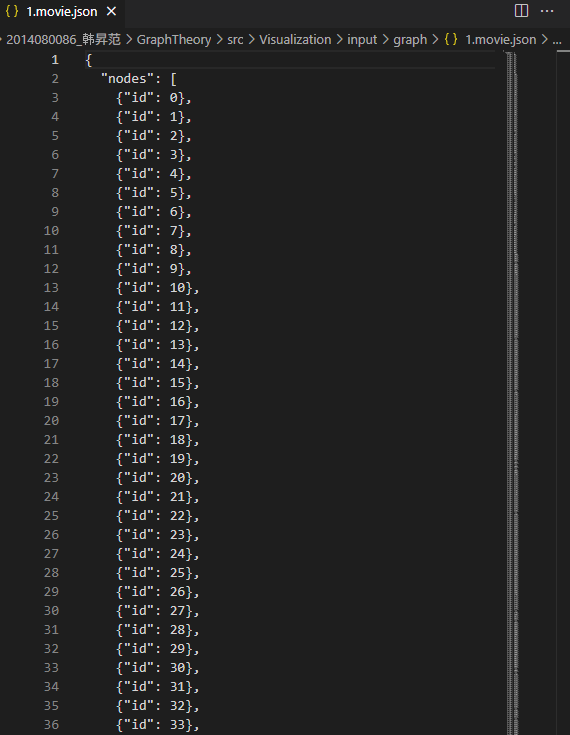
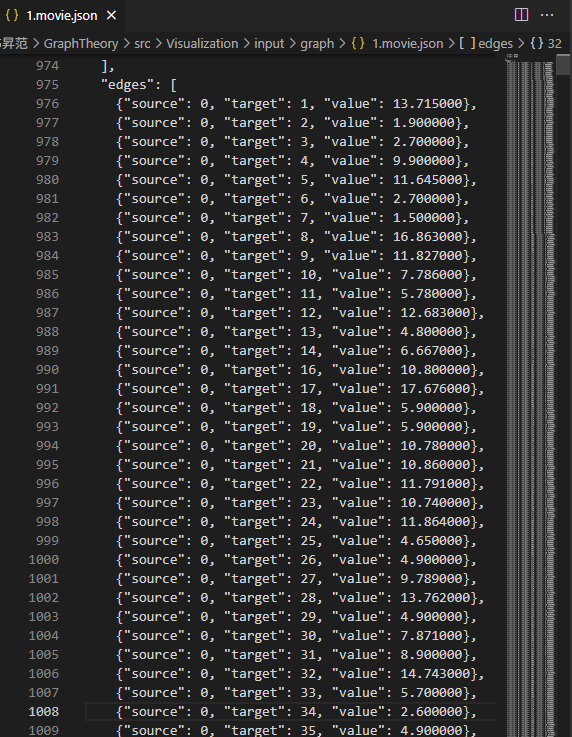
- 1. Graph Information Storage Results (for graph visualization analysis)
- Nodes that do not exist are represented with
"id" = -1(this is done to ensure that the"id"matches its index when using D3.js for visualization). - Images of Results:
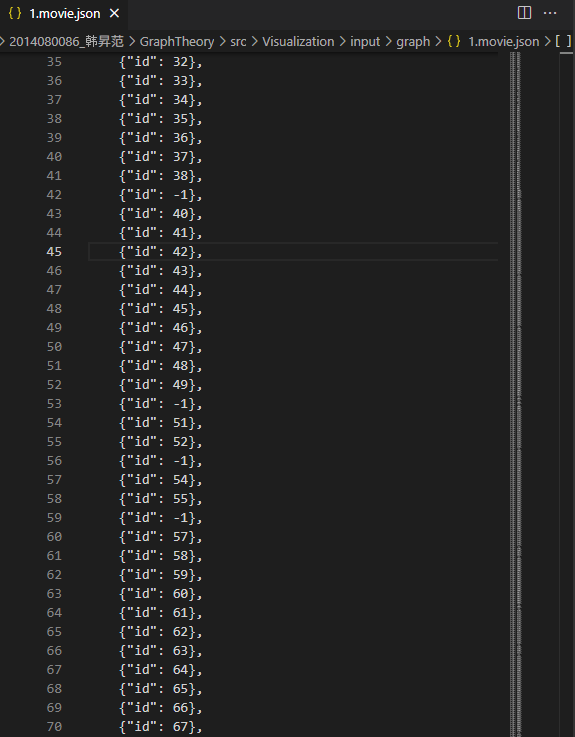
- Nodes that do not exist are represented with
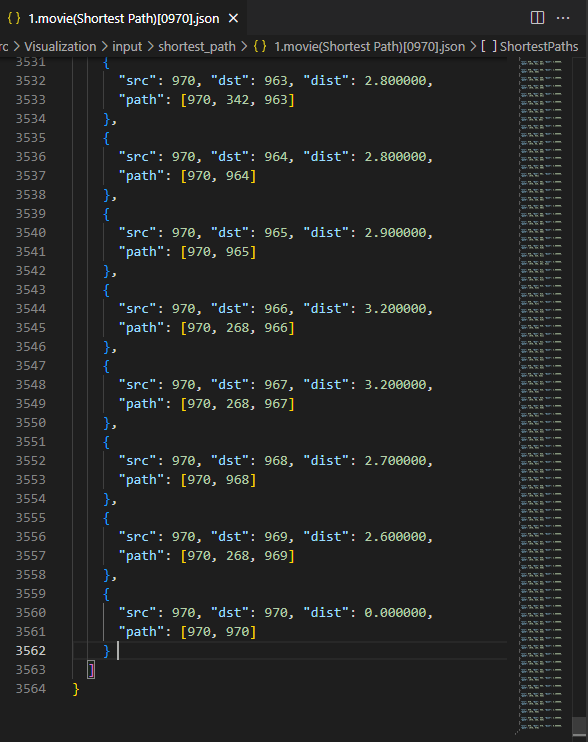
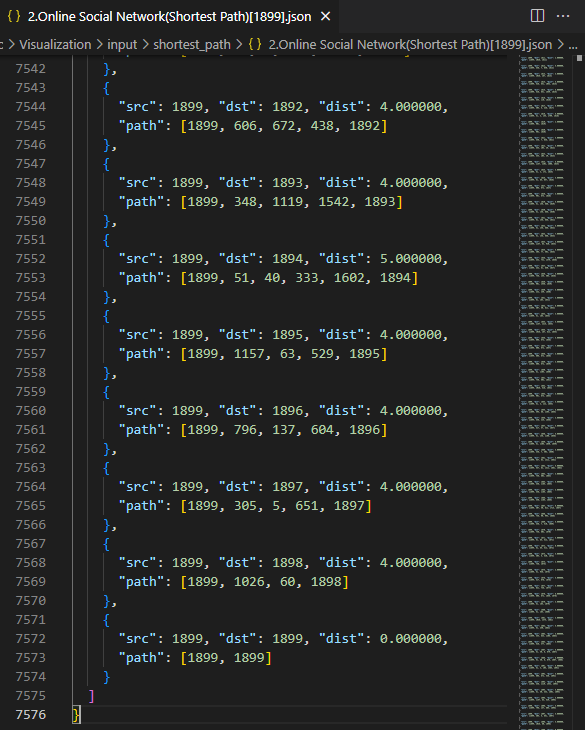
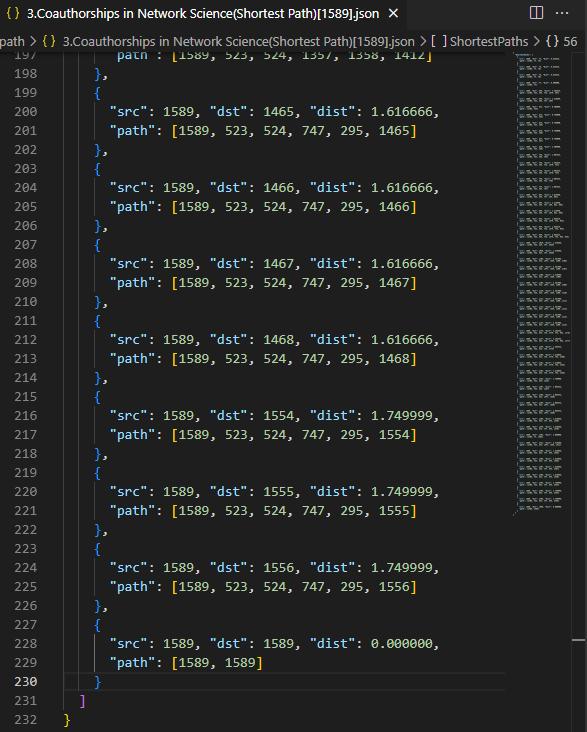
- 2. Shortest Paths Output Results
- If a node doesn't exist, its shortest path won't be included.
- Images of Results:
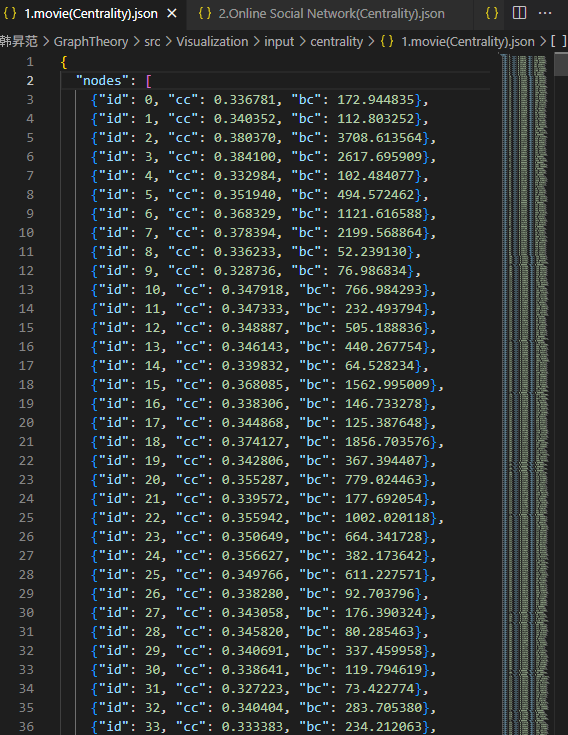
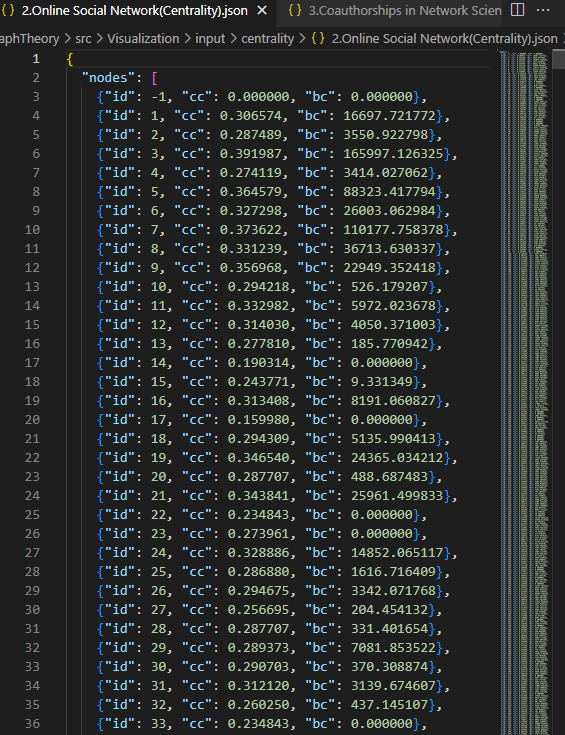
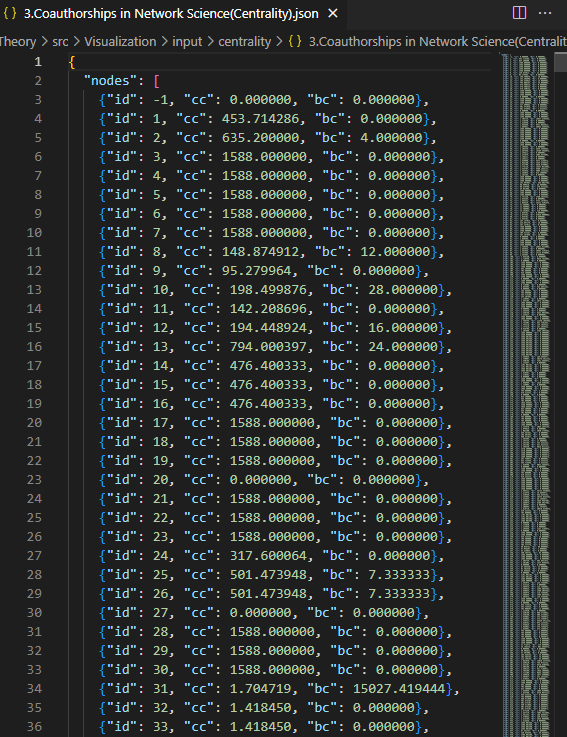
- 3. Centrality Output Results
- Outputs closeness centrality (
"cc") and betweenness centrality ("bc"). - Nodes that do not exist are represented with
"id" = -1. - Images of Results:
- Outputs closeness centrality (
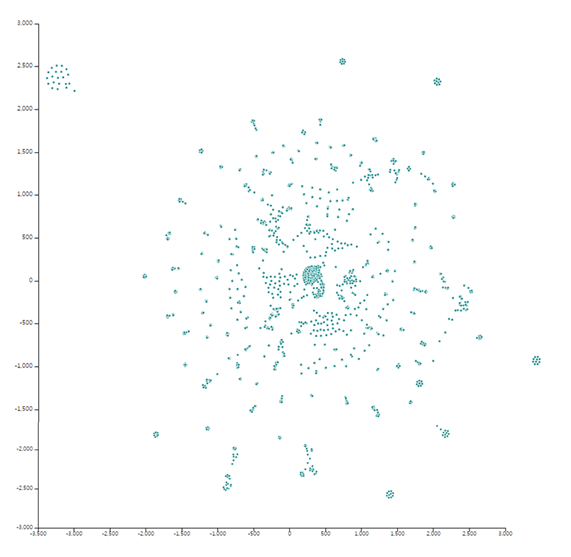
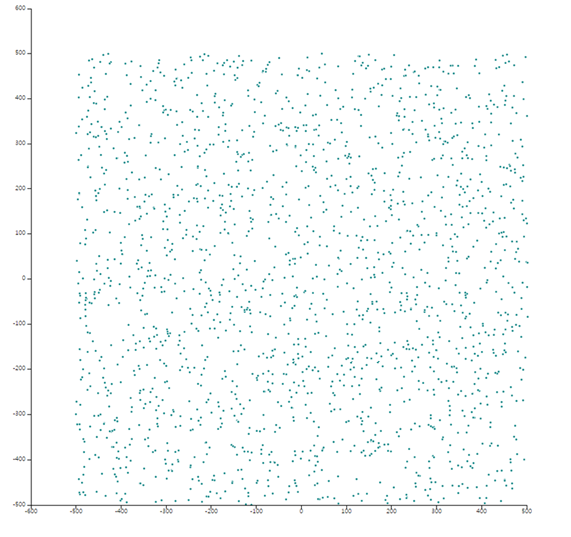
- 4. Graph Visualization Analysis Results
1.movie.txtgraph lacks coordinate data, so its visualization is not required in the project.- Images of Results:
2. Techs
Language / Script
Library
OS
IDE
VCS
Compiler / Transpiler / Bundler / Build Tool
Package Manager / Dependency Manager
Etc.
3. Screenshots